俶俽俠俙傪巊偭偨暘嶶娔帇偺僀儞僗僩乕儖
丂俴俽亅俧俴偱傕埲慜俼倕倓俫倎倲宯偱傗偭偨偙偲偺偁傞俶倎倗倝倧倱偺暘嶶娔帇傪帋傒偨丅
丂 暘嶶娔帇偺奣擮偼丄俶倎倗倝倧倱乮偙偙偱偼儕儌乕僩儂僗僩偲屇傇乯偱廂廤偟偨娔帇僨乕僞傪偦偙偱張棟偣偢暿偺俶倎倗倝倧倱乮偙偙偱偼娔帇儂僗僩偁傞偄偼儌 僯僞儕儞僌儂僗僩偲屇傇乯偵揮憲偟偰偦偙偱昞帵傗捠抦丄摑寁張棟傪偝偣傞偲偄偆曽朄偱偁傝丄戝婯柾僱僢僩儚乕僋傗僼傽僀儎乕僂僅乕儖墇偊偺娔帇偵桳岠側傕 偺偺傛偆偱偁傞丅
丂俶俽俠俙乮俶倎倗倝倧倱 倱倕倰倴倝們倕 倣倧値倝倲倧倰 倎倗倕値倲乯偼偙偺儕儌乕僩偐傜僙儞僩儔儖傊偺僷僢僔僽側僨乕僞偺揮憲張棟傪扴摉偡傞傕偺偱偁傝丄偙傟傪巊偭偨暘嶶娔帇偺峔惉偼埲壓偺傛偆側傕偺偱偁傞丅

丂偙傟傪帋偡偵摉偨偭偰偼丄彮側偔偲傕擇屄偺俶倎倗倝倧倱偑摦偄偰偄傞僷僜僐儞偑昁梫偲側傞丅
丂偆偪堦戜偼丄偙傟傑偱嶌偭偰偒偨俶倎倗倝倧倱傪僀儞僗僩乕儖偟偨俴俽亅俧俴傪僙儞僩儔儖儂僗僩偲偟偰巊偆偙偲偲偡傞偑丄儕儌乕僩梡偺傕偆堦戜偼崱夞怴偨偵嶌惉偡傞昁梫偑偁傞丅
丂偙偺偨傔偺抂枛偼丄偐偭偰俢倕倐倝倎値傪擖傟偰嶌嬈梡抂枛偲偟偰巊偭偰偄偨thinkpad 240傪巊偆偙偲偲偟偰丄
丂倎丏俶倎倗倝倧倱傪偙偙偵偁傞傗傝曽偱僀儞僗僩乕儖
丂丂丂僗僥乕僞僗儅僢僾側偳偺愝掕偼巊傢側偄偺偱偟側偄丅
丂丂丂娔帇崁栚傕僥僗僩梡偺偨傔帺暘偺娔帇偲堦偮掱搙偺儂僗僩乮崱夞偼僀儞僞乕僱僢僩儖乕僞乕乯偲偡傞丅
丂倐丏俢倕倐倝倎値偼抂枛儌乕僪偱僀儞僗僩乕儖偟偰偄傞偺偱apach2偼僀儞僗僩乕儖偝傟偰偄側偄丅
丂丂丂倎倫倎們倛倕俀傪僀儞僗僩乕儖偡傞丅偙傟偼昁恵偱偼側偄偑俶倎倗倝倧倱偺壱摥妋擣偵偼
丂丂丂偁偭偨曽偑曋棙偱偁傞丅
偵傛傝愝掕偟丄僽儔僂僓偱俶倎倗倝倧倱偺摦嶌妋擣傪偍偙側偭偨丅
丂暘嶶娔帇偺愝掕曽朄偼丄埲慜帋偟偨曽朄偵傛偭偨偑丄僶乕僕儑儞偺堘偄傕偁傝懡彮堎側傞偺偱梫揰傪埲壓偵弎傋傞丅
侾丏俶俽俠俙偺僀儞僗僩乕儖乮偙偺崁偼娔帇儂僗僩丄儕儌乕僩儂僗僩嫟摨偠憖嶌傪偡傞丅乯
丂丂俶俽俠俙偼libmcrypt傪巊偆偺偱傑偢偙傟傪僀儞僗僩乕儖
丂丂丒偙偙偐傜嵟怴偺libmcrypt-2.5.7.tar.gz傪僟僂儞儘乕僪
丂丂丒# tar zxvf libmcrypt-2.5.7.tar.gz 偱揔摉側僨傿儗僋僩儕乕偱夝搥
丂丂丒# cd libmcrypt-2.5.7 偱堏摦偟偰
丂丂丒# ./configure
丒# make
丂丂丒# make check
丂丂丂丂丂丂==================
丂丂丂丂丂丂All 2 tests passed
丂丂丂丂丂丂==================
丂丂丂丂偲側傟偽俷俲偐側偀
丂丂丒# make install
丂丂丂丂丂----------------------------------------------------------------------
丂丂丂丂丂Libraries have been installed in:
丂丂丂丂丂 /usr/local/lib
丂丂丂丂丂If you ever happen to want to link against installed libraries
丂丂丂丂丂in a given directory, LIBDIR, you must either use libtool, and
丂丂丂丂丂specify the full pathname of the library, or use the `-LLIBDIR'
丂丂丂丂丂flag during linking and do at least one of the following:
丂丂丂丂丂 - add LIBDIR to the `LD_LIBRARY_PATH' environment variable
丂丂丂丂丂 during execution
丂丂丂丂丂 - add LIBDIR to the `LD_RUN_PATH' environment variable
丂丂丂丂丂 during linking
丂丂丂丂丂 - use the `-Wl,--rpath -Wl,LIBDIR' linker flag
丂丂丂丂丂 - have your system administrator add LIBDIR to `/etc/ld.so.conf'
丂丂丂丂丂See any operating system documentation about shared libraries for
丂丂丂丂丂more information, such as the ld(1) and ld.so(8) manual pages.
丂丂丂丂丂----------------------------------------------------------------------
丂丂丒/etc/ld.so.conf偺嵟廔峴偵/usr/local/lib 傪捛婰丂
丂丂丒# ldconfig 偱愝掕傪斀塮偝偣傞丅
丂丂師偵俶俽俠俙偺僀儞僗僩乕儖
丂丂丒偙偙偐傜nsca-2.7.2.tar.gz 傪僟僂儞儘乕僪
丂丂丒# tar zxvf nsca-2.7.2.tar.gz 偱揔摉側僨傿儗僋僩儕乕偵夝搥
丂丂丒# cd nsca-2.7.2 偱堏摦偟偰
丂丂丒# ./configure
丂丂丂丂丂*** Configuration summary for nsca 2.7.2 07-03-2007 ***:
丂丂丂丂丂General Options:
丂丂丂丂丂-------------------------
丂丂丂丂丂 NSCA port: 5667
丂丂丂丂丂 NSCA user: nagios
丂丂丂丂丂 NSCA group: nagios
丂丂丂丂丂Review the options above for accuracy. If they look okay,
丂丂丂丂丂type 'make all' to compile the NSCA daemon and client.
丂丂丒# make all
丂丂丂丂丂*** Compile finished ***
丂丂丂丂丂If the compile finished without any errors, you should
丂丂丂丂丂find client and server binaries in the src/ subdirectory.
丂丂丂丂丂Read the README file for more information on installing
丂丂丂丂丂the binaries, creating configuration files, and using
丂丂丂丂丂the server and client.
丂丂丒# ls src丂偱寢壥傪妋擣偡傞丅
丂丂丂丂丂Makefile netutils.c nsca.c send_nsca.c
丂丂丂丂丂Makefile.in nsca send_nsca utils.c
丂丂丒nsca.cfg偲send_nsca.cfg偺廋惓
丂丂丂nsca.cfg
| #################################################### # Sample NSCA Daemon Config File # Written by: Ethan Galstad (nagios@nagios.org) # # Last Modified: 04-03-2006 #################################################### # PID FILE # The name of the file in which the NSCA daemon should write it's process ID # number. The file is only written if the NSCA daemon is started by the root # user as a single- or multi-process daemon. pid_file=/var/run/nsca.pid # PORT NUMBER # Port number we should wait for connections on. # This must be a non-priveledged port (i.e. > 1024). server_port=5667 # SERVER ADDRESS # Address that NSCA has to bind to in case there are # more as one interface and we do not want NSCA to bind # (thus listen) on all interfaces. #server_address=192.168.1.1 # NSCA USER # This determines the effective user that the NSCA daemon should run as. # You can either supply a username or a UID. # # NOTE: This option is ignored if NSCA is running under either inetd or xinetd nsca_user=nagios # NSCA GROUP # This determines the effective group that the NSCA daemon should run as. # You can either supply a group name or a GID. # # NOTE: This option is ignored if NSCA is running under either inetd or xinetd nsca_group=nagiocmd丂nagios偐傜廋惓丅娭學偼側偝偦偆 # NSCA CHROOT # If specified, determines a directory into which the nsca daemon # will perform a chroot(2) operation before dropping its privileges. # for the security conscious this can add a layer of protection in # the event that the nagios daemon is compromised. # # NOTE: if you specify this option, the command file will be opened # relative to this directory. #nsca_chroot=/var/run/nagios/rw # DEBUGGING OPTION # This option determines whether or not debugging # messages are logged to the syslog facility. # Values: 0 = debugging off, 1 = debugging on debug=1丂0偐傜廋惓丅摉弶僨乕僞揱憲偑忋庤偔偄偐偢妋擣偺偨傔僙僢僩丅幚塣梡偱偼0偵廋惓 # COMMAND FILE # This is the location of the Nagios command file that the daemon # should write all service check results that it receives. command_file=/usr/local/nagios/var/rw/nagios.cmd # ALTERNATE DUMP FILE # This is used to specify an alternate file the daemon should # write service check results to in the event the command file # does not exist. It is important to note that the command file # is implemented as a named pipe and only exists when Nagios is # running. You may want to modify the startup script for Nagios # to dump the contents of this file into the command file after # it starts Nagios. Or you may simply choose to ignore any # check results received while Nagios was not running... alternate_dump_file=/usr/local/nagios/var/rw/nsca.dump # AGGREGATED WRITES OPTION # This option determines whether or not the nsca daemon will # aggregate writes to the external command file for client # connections that contain multiple check results. If you # are queueing service check results on remote hosts and # sending them to the nsca daemon in bulk, you will probably # want to enable bulk writes, as this will be a bit more # efficient. # Values: 0 = do not aggregate writes, 1 = aggregate writes aggregate_writes=1丂壗屘偐0偐傜掶惓丅棟桼偼暘傜側偄丅 # APPEND TO FILE OPTION # This option determines whether or not the nsca daemon will # will open the external command file for writing or appending. # This option should almost *always* be set to 0! # Values: 0 = open file for writing, 1 = open file for appending append_to_file=1丂偙傟傕忋偲摨偠 # MAX PACKET AGE OPTION # This option is used by the nsca daemon to determine when client # data is too old to be valid. Keeping this value as small as # possible is recommended, as it helps prevent the possibility of # "replay" attacks. This value needs to be at least as long as # the time it takes your clients to send their data to the server. # Values are in seconds. The max packet age cannot exceed 15 # minutes (900 seconds). If this variable is set to zero (0), no # packets will be rejected based on their age. max_packet_age=30 # DECRYPTION PASSWORD # This is the password/passphrase that should be used to descrypt the # incoming packets. Note that all clients must encrypt the packets # they send using the same password! # IMPORTANT: You don't want all the users on this system to be able # to read the password you specify here, so make sure to set # restrictive permissions on this config file! password=nagios丂偙傟偼昁恵 # DECRYPTION METHOD # This option determines the method by which the nsca daemon will # decrypt the packets it receives from the clients. The decryption # method you choose will be a balance between security and performance, # as strong encryption methods consume more processor resources. # You should evaluate your security needs when choosing a decryption # method. # # Note: The decryption method you specify here must match the # encryption method the nsca clients use (as specified in # the send_nsca.cfg file)!! # Values: # # 0 = None (Do NOT use this option) # 1 = Simple XOR (No security, just obfuscation, but very fast) # # 2 = DES # 3 = 3DES (Triple DES) # 4 = CAST-128 # 5 = CAST-256 # 6 = xTEA # 7 = 3WAY # 8 = BLOWFISH # 9 = TWOFISH # 10 = LOKI97 # 11 = RC2 # 12 = ARCFOUR # # 14 = RIJNDAEL-128 # 15 = RIJNDAEL-192 # 16 = RIJNDAEL-256 # # 19 = WAKE # 20 = SERPENT # # 22 = ENIGMA (Unix crypt) # 23 = GOST # 24 = SAFER64 # 25 = SAFER128 # 26 = SAFER+ # decryption_method=3 |
丂丂丂send_nsca.cfg
| #################################################### # Sample NSCA Client Config File # Written by: Ethan Galstad (nagios@nagios.org) # # Last Modified: 02-21-2002 #################################################### # ENCRYPTION PASSWORD # This is the password/passphrase that should be used to encrypt the # outgoing packets. Note that the nsca daemon must use the same # password when decrypting the packet! # IMPORTANT: You don't want all the users on this system to be able # to read the password you specify here, so make sure to set # restrictive permissions on this config file! password=nagios丂儂僗僩偵偁傢偡 # ENCRYPTION METHOD # This option determines the method by which the send_nsca client will # encrypt the packets it sends to the nsca daemon. The encryption # method you choose will be a balance between security and performance, # as strong encryption methods consume more processor resources. # You should evaluate your security needs when choosing an encryption # method. # # Note: The encryption method you specify here must match the # decryption method the nsca daemon uses (as specified in # the nsca.cfg file)!! # Values: # 0 = None (Do NOT use this option) # 1 = Simple XOR (No security, just obfuscation, but very fast) # # 2 = DES # 3 = 3DES (Triple DES) # 4 = CAST-128 # 5 = CAST-256 # 6 = xTEA # 7 = 3WAY # 8 = BLOWFISH # 9 = TWOFISH # 10 = LOKI97 # 11 = RC2 # 12 = ARCFOUR # # 14 = RIJNDAEL-128 # 15 = RIJNDAEL-192 # 16 = RIJNDAEL-256 # # 19 = WAKE # 20 = SERPENT # # 22 = ENIGMA (Unix crypt) # 23 = GOST # 24 = SAFER64 # 25 = SAFER128 # 26 = SAFER+ # encryption_method=3丂儂僗僩偵偁傢偡 |
丂丂丒奺庬僼傽僀儖偺攝抲
| 丂 | 娔帇儂僗僩 | 儕儌乕僩儂僗僩 |
| 僶僀僫儕 僼傽僀儖 |
/usr/local/nagios/bin/nsca | /usr/local/nagios/libexec/send_nsca |
| 掕媊僼傽僀儖 | /usr/loca/nagios/var/nsca.cfg | /usr/local/nagios/var/send_nsca.cfg |
丂丂丒娔帇儂僗僩偱偺nsca婲摦庤懕偒乮偙傟偼僔僗僥儉偵傛傝堎側傞丅Debian etch偺応崌乯
/etc/inetd.conf偵壓婰傪捛壛
| #:NSCA nsca stream tcp nowait nagios /usr/sbin/tcpd /usr/local/nagios/bin/nsca -c /usr/local/nagios/var/nsca.cfg --inetd |
丂丂丂億乕僩偺捛壛丂/etc/service偺奩摉応強偵丂nsca 5667/tcp # NACA for Nagios丂傪捛婰
丂丂丂偙偺億乕僩捛壛偼擮偺偨傔儕儌乕僩懁偵傕捛壛偟偨偑晄梫偐傕偟傟側偄丅
丂丂丒摦嶌妋擣傪偟偨偐偭偨偑俶俽俠俙扨懱偱偺曽朄偑暘傜側偐偭偨丅俶倎倗倝倧倱娷傔幚巤
俀丏俶倎倗倝倧倱偺愝掕
丂倎丏儕儌乕僩儂僗僩懁
丂丂丂丒nagios.cfg
丂丂丂丂enable_notifications=0
丂丂丂丂obsess_over_services=1
丂丂丂丂ocsp_command=submit_check_result
丂丂丂丒localhost.cfg偺枛旜偵婰嵹丅command.cfg偱傕椙偝偦偆丅
丂丂丂丂define command{
丂丂丂丂command_name submit_check_result
丂丂丂丂command_line /usr/local/nagios/libexec/submit_check_result $HOSTNAME$ 丂丂丂丂丂丂丂丂丂丂丂丂丂丂丂丂丂丂丂'$SERVICEDESC$' $SERVICESTATE$ '$SERVICEOUTPUT$'
丂丂丂丂}
丂丂丂丒/usr/local/nagios/libexec/submit_check_result傪壓婰撪梕偱捛婰丅僷乕儈僢僔儑儞傪幚峴嫋壜
| #!/bin/sh return_code=-1 case "$3" in OK) return_code=0 ;; WARNING) return_code=1 ;; CRITICAL) return_code=2 ;; UNKNOWN) return_code=-1 ;; esac /usr/bin/printf "%s\t%s\t%s\t%s\n" "$1" "$2" "$return_code" "$4" | /usr/local/nagios/bin/send_nsca -H 192.168.0.71 -c /usr/local/nagios/var/send_nsca.cfg |
丂倐丏娔帇儂僗僩懁
丂丂丒nagios.cfg
丂丂丂丂丂execute_service_checks=1
丂丂丂丂丂accept_passive_service_checks=1
丂丂丂丂丂retain_state_information=0
丂丂丂丂丂use_retained_program_state=0
丂丂丒localhost.cfg偺掕媊
丂丂丂丂丂怴偟偄悧宆passive-server傪捛壛
丂丂丂丂丂define host{
丂丂丂丂丂 name passive-server
丂丂丂丂丂use generic-host
丂丂丂丂丂check_period 24x7
丂丂丂丂丂max_check_attempts 10
丂丂丂丂丂# check_command check-host-alive丂僠僃僢僋傪偟側偄
丂丂丂丂丂notification_period workhours
丂丂丂丂丂notification_interval 120
丂丂丂丂丂notification_options d,u,r
丂丂丂丂丂contact_groups admins
丂丂丂丂丂register 0
丂丂丂丂丂 }
丂丂丂丂幚嵺偺儂僗僩掕媊
丂丂丂丂define host{
丂 丂丂丂丂 use passive-server
丂丂丂丂丂host_name thinkpad
丂丂丂丂丂alias RemoteNagios
丂丂丂丂丂address 192.168.0.64
丂丂丂丂丂 parents LS-GL
丂丂丂丂丂}
丂丂丂丂define host{
丂丂丂丂丂use passive-server
丂丂丂丂丂host_name router
丂丂丂丂丂alias BBR-4HG
丂丂丂丂丂address 192.168.0.254
丂丂丂丂丂parents LS-GL
丂丂丂丂丂}
丂丂丂丂僒乕價僗掕媊偺堦斒悧宆generic-service2捛壛
丂丂丂丂define service{
丂丂丂丂丂name generic-service2
丂丂丂丂丂active_checks_enabled 0
丂丂丂丂丂passive_checks_enabled 1
丂丂丂丂丂parallelize_check 1
丂丂丂丂丂obsess_over_service 1
丂丂丂丂丂check_freshness 1
丂 丂丂丂丂 notifications_enabled 1
丂丂丂丂丂event_handler_enabled 1
丂丂丂丂丂flap_detection_enabled 1
丂丂丂丂丂failure_prediction_enabled 1
丂丂丂丂丂process_perf_data 1
丂丂丂丂丂retain_status_information 1
丂丂丂丂丂is_volatile 0
丂丂丂丂丂register 0
丂丂丂丂丂}
丂丂丂丂屄暿悧宆passive-service捛壛
丂丂丂丂define service{
丂丂丂丂丂name passive-service
丂丂丂丂丂use generic-service2
丂丂丂丂丂check_period 24x7
丂丂丂丂丂max_check_attempts 4
丂丂丂丂丂normal_check_interval 5
丂丂丂丂丂retry_check_interval 1
丂丂丂丂丂 contact_groups admins
丂丂丂丂丂notification_options w,u,c,r
丂丂丂丂丂notification_interval 60
丂丂丂丂丂notification_period 24x7
丂丂丂丂丂freshness_threshold 120
丂丂丂丂丂register 0
丂丂丂丂丂}
丂丂丂丂幚嵺偺僒乕價僗掕媊
丂丂丂丂define service{
丂丂丂丂丂use passive-service
丂丂丂丂丂host_name thinkpad
丂丂丂丂丂service_description PING
丂丂丂丂丂check_command service-is-stale
丂丂丂丂丂}
丂丂丂丂define service{
丂丂丂丂丂use passive-service
丂丂丂丂丂host_name thinkpad
丂丂丂丂丂service_description Root Partition
丂丂丂丂丂check_command service-is-stale
丂丂丂丂丂}
丂丂丂丂define service{
丂丂丂丂丂use passive-service
丂丂丂丂丂host_name router
丂丂丂丂丂service_description PING
丂丂丂丂丂check_command service-is-stale
丂丂丂丂丂}
丂丂丂丒command.cfg偺嵟壓峴偵捛婰
丂丂丂丂丂########################################################
丂丂丂丂丂# Add freshness_check
丂丂丂丂丂########################################################
丂丂丂丂丂define command{
丂丂丂丂丂command_name service-is-stale
丂丂丂丂丂command_line /usr/local/nagios/libexec/staleservice.sh
丂丂丂丂丂}
丂丂丂丒/usr/local/nagios/libexec/staleservice.sh偺嶌惉丄幚峴宍幃偵chmod
丂丂丂丂丂#!/bin/sh
丂丂丂丂丂/bin/echo "CRITICAL: Service results are stale!"
丂丂丂丂丂exit 2
俁丏摦嶌妋擣
丂偙偺愝掕傪峴偭偨屻丄椉僒乕僶乕偺俶倎倗倝倧倱傪婲摦偟偨偑丄儕儌乕僩娔帇偵偮偄偰偼慡偔摦偄偨宍愓偑側偐偭偨丅
丂怓乆挷傋偰傒偨寢壥丄戝偒偔偼師偺擇偮偱偁傝丄壗偲偐夝寛偡傞偙偲偑弌棃偨丅
丂倎丏娔帇僒乕僶乕懁偺nsca偑婲摦偟偰偄側偐偭偨丅
丂丂丂偙傟偼/etc/inetd.conf傪偠偭偔傝尒偰偄傞偆偪偵婥偑偮偄偨丅俿俠俹倂倰倎倫倫倕倰偺桳柍偟偑娫丂堘偭偰偄偨帠偵傛傞傕偺偱偁傝丄廋惓偟偰夞暅丅夞暅慜偼丄/var/log/daemon.log側偳偺儘僌椶傪尒偰傒傞偑壗偺斀墳傕偟偰偄側偐偭偨丅
丂丂丂儕儌乕僩懁偺憲怣摦嶌傪傛傝妋幚偲偡傞偨傔# /usr/local/nagios/bin/send_nsca -H 192.168.0.71 -c /usr/local/nagios/var/send_nsca.cfg 偲捈愙僐儅儞僪傪懪偭偰傒偰傕壗偺斀墳傕偟側偐偭偨丅
丂丂丂偟偐偟丄夞暅屻偼
丂丂丂Apr 12 17:46:06 test nsca[2329]: connect from 192.168.0.64 (192.168.0.64)
丂倐丏儕儌乕僩儂僗僩懁submit_check_result偺晄旛
丂丂丂忋偺懳嶔偱僨乕僞揱憲偼弌棃傞傛偆偵側偭偨偑丄忬懺昞帵偑惓忢偲側傜側偄丅
丂 丂丂偙偺偨傔丄慜弎偺nsca.cfg偱debug=1偲偟偰儘僌偺撪梕傪憹傗偟偰傒偨丅submit_check_result傪挷傋偰偄傞撪偵TAB 僉乕偱僇乕僜儖傪堏摦偟側偄偲偄偗側偄偺偵僗儁乕僗僉乕偱堏摦偟偰偄偨偺偱僗僋儕僾僩偑屻敾抐偟偰慡偰晄惓忢偺寢壥傪憲偭偰偒偰偄偨丅儊僢僙乕僕偺撪梕偼 埲壓偺捠傝偱偁傞丅
丂丂丂tail /var/log/deamon.log丂堎忢帪丂Return Code: '-1'偲側偭偰偄傞丅
丂丂丂Apr 12 17:44:26 test nsca[2316]: End of connection...
丂丂丂Apr 12 17:46:06 test nsca[2329]: connect from 192.168.0.64 (192.168.0.64)
丂丂丂Apr 12 17:46:06 test nsca[2329]: Handling the connection...
丂 丂丂Apr 12 17:46:06 test nsca[2329]: SERVICE CHECK -> Host Name: 'thinkpad', Service 丂丂丂丂丂丂丂丂Description: 'PING', Return Code: '-1', Output: 'PING OK - Packet loss = 0%, RTA = 0.18 ms'
丂丂丂Apr 12 17:46:06 test nsca[2329]: End of connection...
丂丂丂惓忢帪偺昞帵
丂丂丂Apr 12 20:04:43 test nsca[3829]: connect from 192.168.0.64 (192.168.0.64)
丂丂丂Apr 12 20:04:43 test nsca[3829]: Handling the connection...
丂 丂丂Apr 12 20:04:43 test nsca[3829]: SERVICE CHECK -> Host Name: 'thinkpad', Service 丂丂丂丂丂丂丂丂Description: 'Root Partition', Return Code: '0', Output: 'DISK OK - free space: / 886 MB 丂丂丂丂(32% inode=74%):'
丂丂丂Apr 12 20:04:43 test nsca[3829]: End of connection...
係丏奺庬娔帇夋柺
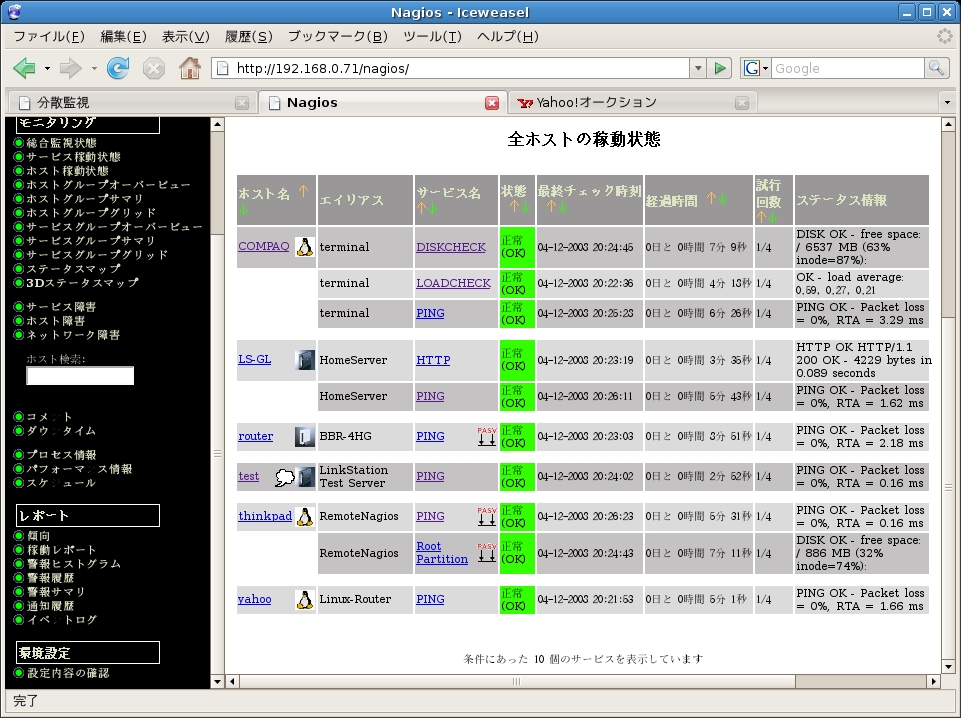
丂倎丏惓忢庴怣

丂僷僢僔僽娔帇偺儅乕僋偑
 偲側偭偰偄傞丅
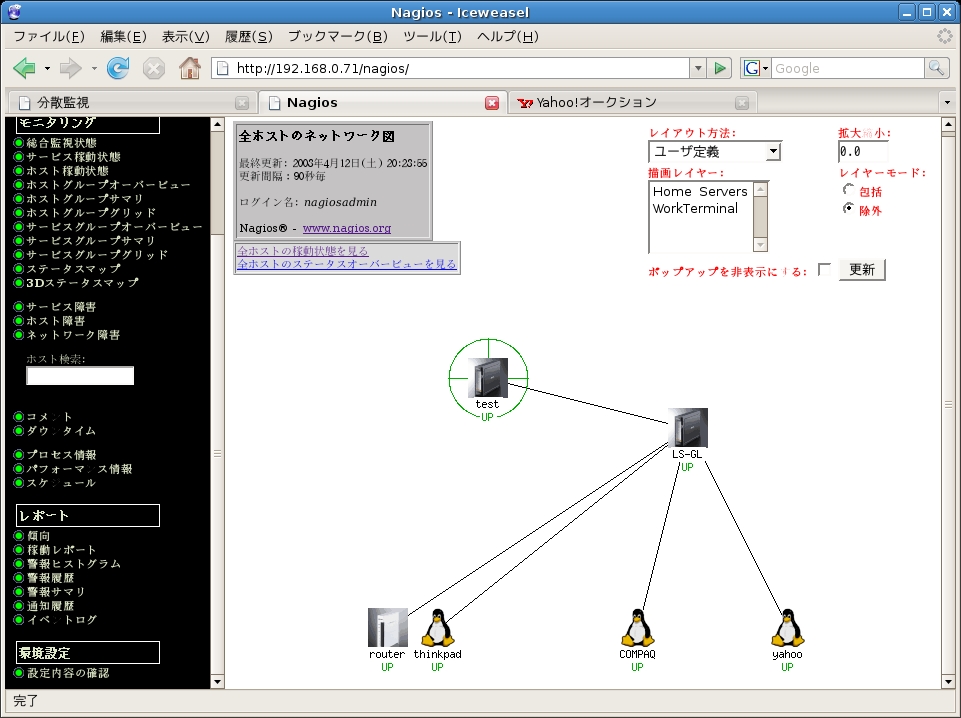
丂倐丏忋偺忬懺偺帪偺僗僥乕僞僗儅僢僾

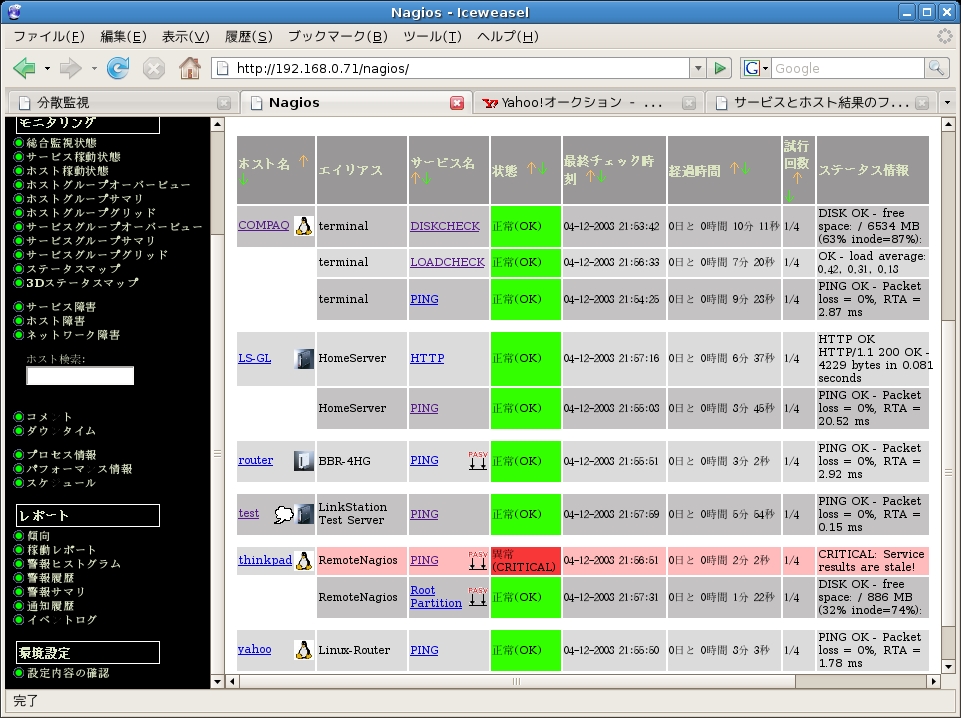
丂們丏僼儗僢僔儏僱僗僠僃僢僋偱堎忢偲側偭偨椺

丂僗僥乕僞僗忣曬棑偵staleservice.sh偱愝掕偟偨CRITICAL: Service results are stale!偑昞帵偝傟偰偄傞丅
乮嶲峫乯
儕儌乕僩懁俶倎倗倝倧倱偺localhost.cfg 偵偍偗傞host 掕媊
define host{
use linux-server
host_name thinkpad
alias localhost
address 127.0.0.1
}
define host{
use linux-server
host_name router
alias BBR-4HG
address 192.168.0.254
}
僒乕價僗掕媊
define service{
use local-service ; Name of service template to use
host_name thinkpad
service_description PING
check_command check_ping!100.0,20%!500.0,60%
}
define service{
use local-service ; Name of service template to use
host_name thinkpad
service_description Root Partition
check_command check_local_disk!20%!10%!/
}
define service{
use local-service
host_name router
service_description PING
check_command check_ping!100.0,20%!500.0,60%
}
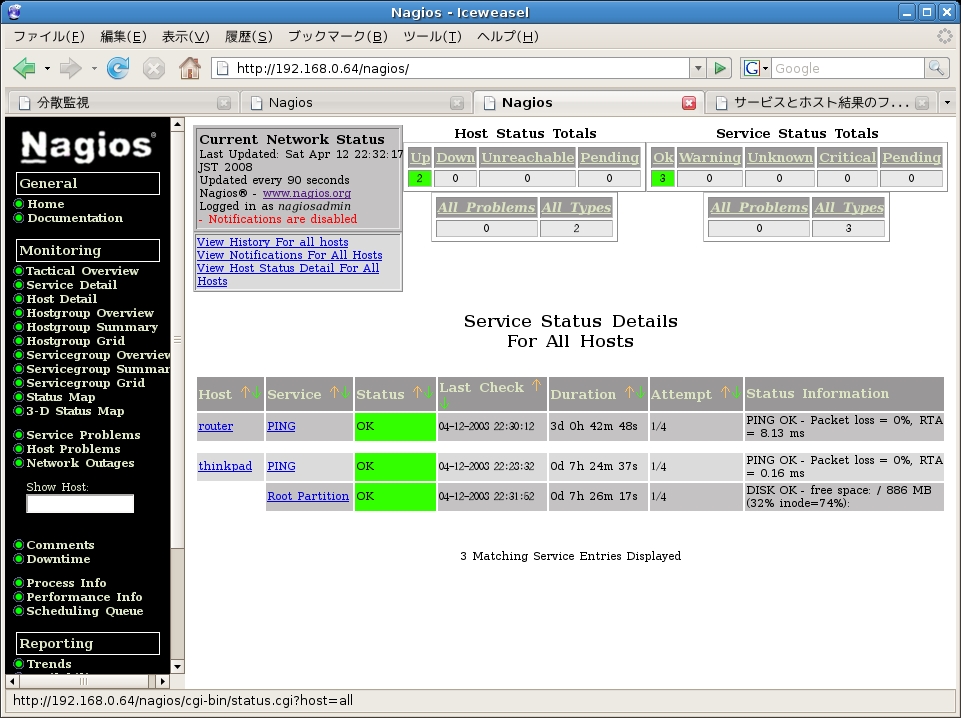
丂偙偺帪偺娔帇夋柺

儂乕儉儁乕僕僩僢僾丂丂俴倝値倠俽倲倎倲倝倧値僩僢僾